Backtesting Basics: How to Test Your Strategy on Historical Forex Data
Stepping into the live currency markets with an unproven strategy is like launching a brand-new commercial aircraft without putting it through a flight simulator first. Backtesting gives you a risk-free environment to stress-test your ideas against real historical market data before putting actual capital on the line. Building this research phase into your routine is the single most effective way to eliminate emotional guesswork and find out if your system possesses a genuine mathematical edge.
What exactly is backtesting, and how does it protect my account?
Backtesting is the process of applying your technical trading rules to past market charts to see how your strategy would have performed historically. You are essentially reconstructing a hypothetical historical track record for your system.
Think of this process like researching a used car’s service history before handing over your hard-earned cash. If a car repeatedly broke down every fifty miles in the past, you wouldn’t expect it to magically run flawlessly tomorrow. Backtesting strips away the deceptive illusion of hindsight, forcing you to look at the cold, hard numbers of your strategy’s drawdowns and win-loss streaks. By tracking these variables on an advanced execution interface provided by a high-performance best forex broker for mt5, you gain the historical proof needed to trade with calm, systematic confidence.
Should I test my strategy manually or use automated software?
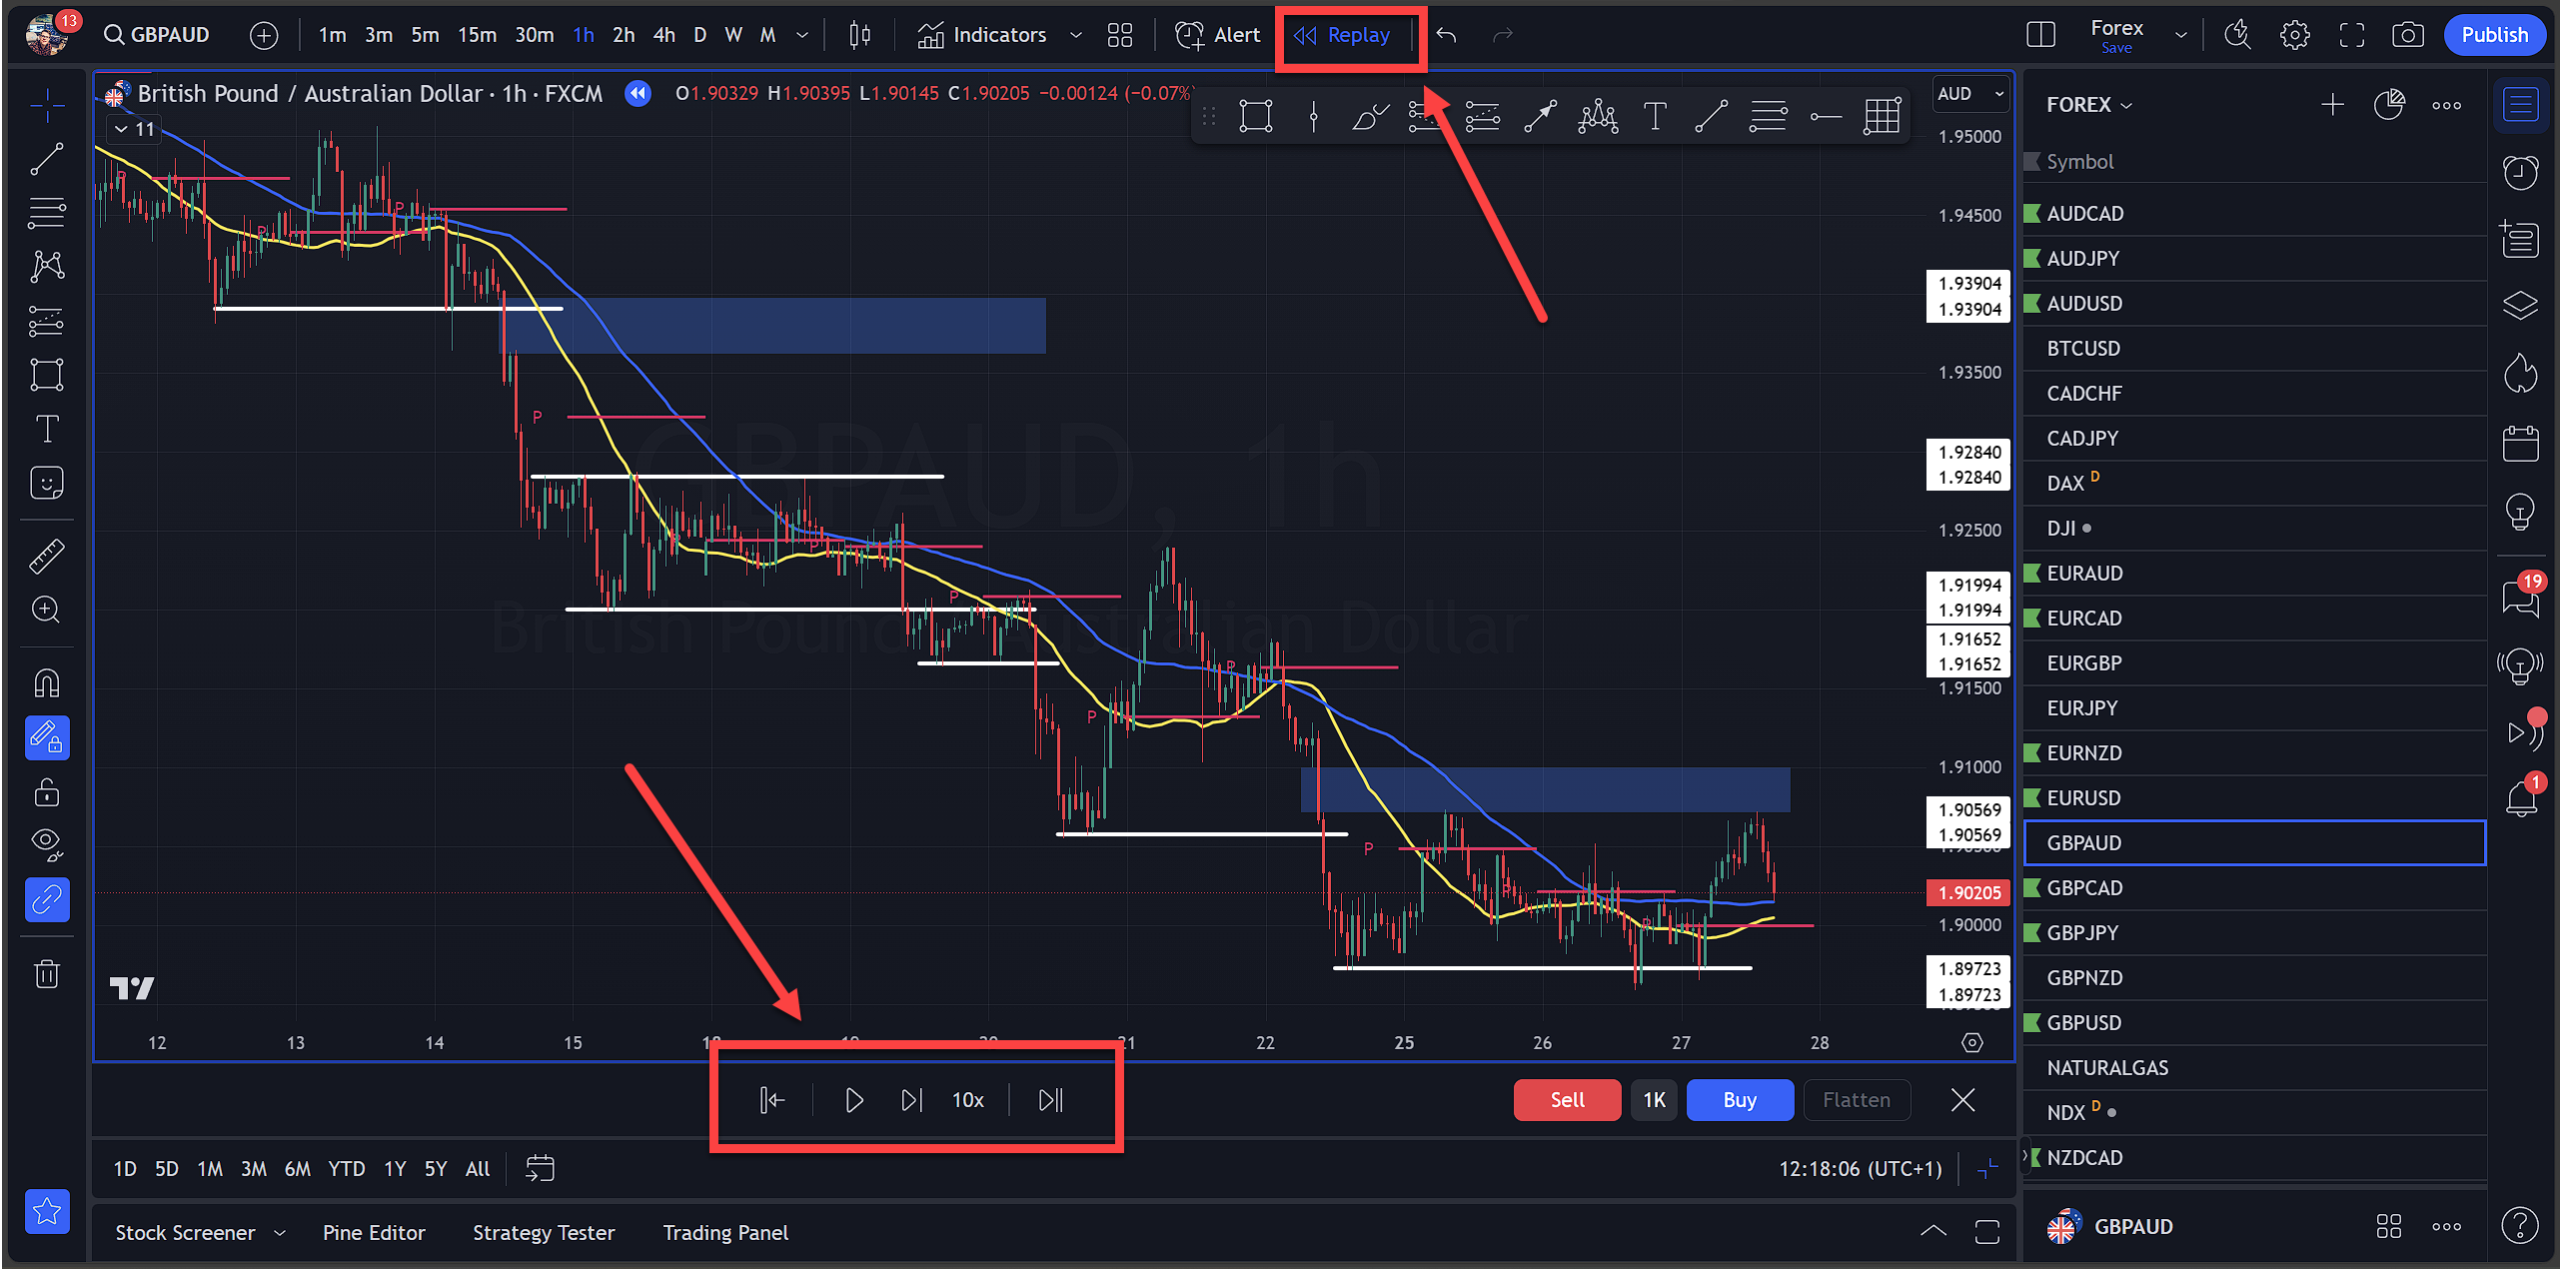
Both paths offer completely unique benefits, and your choice depends heavily on your technical skills and overall style. Manual backtesting involves clicking through historical charts bar-by-bar, printing out signals, and manually recording every single outcome in a spreadsheet. This slow, disciplined method is incredibly valuable because it forces you to train your eyes to read organic price developments in real time.
Automated testing relies on coding your rules into a script to scan decades of data in a few seconds. While automation saves a massive amount of time, it can disconnect you from the nuanced psychological realities of live chart tracking. For people currently exploring how to start forex trading efficiently, starting with manual logging builds an intimate, irreplaceable intuition for market structure before attempting to automate anything.
How much historical data do I actually need to compile a reliable test?
A tiny sample size of ten or twenty trades is a dangerous trap that often breeds false confidence. Markets cycle through completely different phases, shifting rapidly from clean, aggressive trends to messy, volatile ranges. A system that prints flawless profits during an active trend might completely collapse when the price drops into a tight consolidation zone.
To build a truly bulletproof baseline, you should aim to collect a minimum of one hundred consecutive historical trade samples spanning at least one to two full calendar years. This expansive data pool ensures your strategy faces diverse macroeconomic environments, bank holidays, and sudden volatility shocks. The broader your sample size, the more accurate your final statistical expectations will be when navigating real live trends.
What are the most important performance metrics I should track?
Many developing traders make the fatal mistake of focusing exclusively on their gross win rate, but that number is only one piece of a much larger puzzle. You must track your average win size compared to your average loss size, a metric known as your risk-to-reward ratio.
A strategy with a modest 40% win rate can remain highly lucrative if your winning trades are regularly three times larger than your losing ones. Additionally, you must calculate your maximum drawdown, which represents the largest peak-to-trough drop in your account balance during a losing streak. Knowing your maximum historical drawdown beforehand stops you from panicking or abandoning your rules when you inevitably encounter a standard run of bad luck in the live market.
What is the biggest hidden mistake people make during historical testing?
The single biggest trap in historical strategy research is a psychological bias known as curve-fitting or over-optimization. This happens when you subconsciously tweak your original trading rules perfectly to match a specific past chart layout.
You change a moving average parameter here or widen a stop-loss there just to make a known historical loss magically disappear from your spreadsheet. While this optimization creates a flawless, stunning equity curve on your historical data, it usually fails miserably when deployed in live, unpredictable market conditions. You must keep your rule parameters simple, objective, and consistent throughout the entire testing process. If a rule requires complex mental gymnastics to justify an entry on a past chart, it will definitely cause execution failure when the candles are printing live.
Practical Takeaway
Pick one specific currency pair and dedicate your next weekend session to tracking one hundred consecutive trade setups across past charts without making any changes to your core rules. Record your entries, stop-losses, exit points, and the exact drawdowns inside a clean tracking sheet. If the final performance data shows a stable, mathematically positive expectancy over that broad historical period, migrate your system safely to a live micro account with minimal financial exposure. Maintaining this rigorous verification process protects your capital base from unforced technical errors and ensures your strategy operates on structural evidence rather than blind, hopeful speculation.